Deloitte Data Analytics Simulation
Analyzed complex business datasets, developed interactive Power BI dashboards with advanced DAX, delivered strategic recommendations resulting in 15% simulated cost reduction.
Power BIDAXBusiness Analysis
Transforming raw data into actionable business insights. Available for freelance projects and full-time roles.


Introduction
Results-driven Data Analyst with an 8.2/10 GPA (BCA, Kalinga University 2023). Specialized expertise in building interactive Power BI dashboards, writing optimized SQL queries, and automating Excel workflows. Certified by Deloitte, TATA, and Coding Ninjas. Multilingual professional (English C1/C2, Portuguese B1/B2, Hindi Native) passionate about transforming complex datasets into compelling business narratives.
Capabilities
Credentials
July 2026
Hands-on business analytics: forensic data review, dashboard building and translating findings into client-ready recommendations.
July 2026
Designing insight-led visuals for executive audiences, choosing the right chart for the question and framing data stories for leadership.
June 2026
Advanced Excel workflows: nested lookups, Power Query transformations and macro automation, finishing as a top-performing participant.
Selected work
Analyzed complex business datasets, developed interactive Power BI dashboards with advanced DAX, delivered strategic recommendations resulting in 15% simulated cost reduction.
Designed executive-level dashboards and created automated reporting solutions reducing manual generation time by 40%.
Built a comprehensive relational database with 10+ normalized tables, wrote complex SQL queries (JOINs, CTEs, Window Functions) and optimized query performance by 30%.
Dashboard Projects
Three real dashboards I designed and built end to end — from data modeling to the final interactive report.
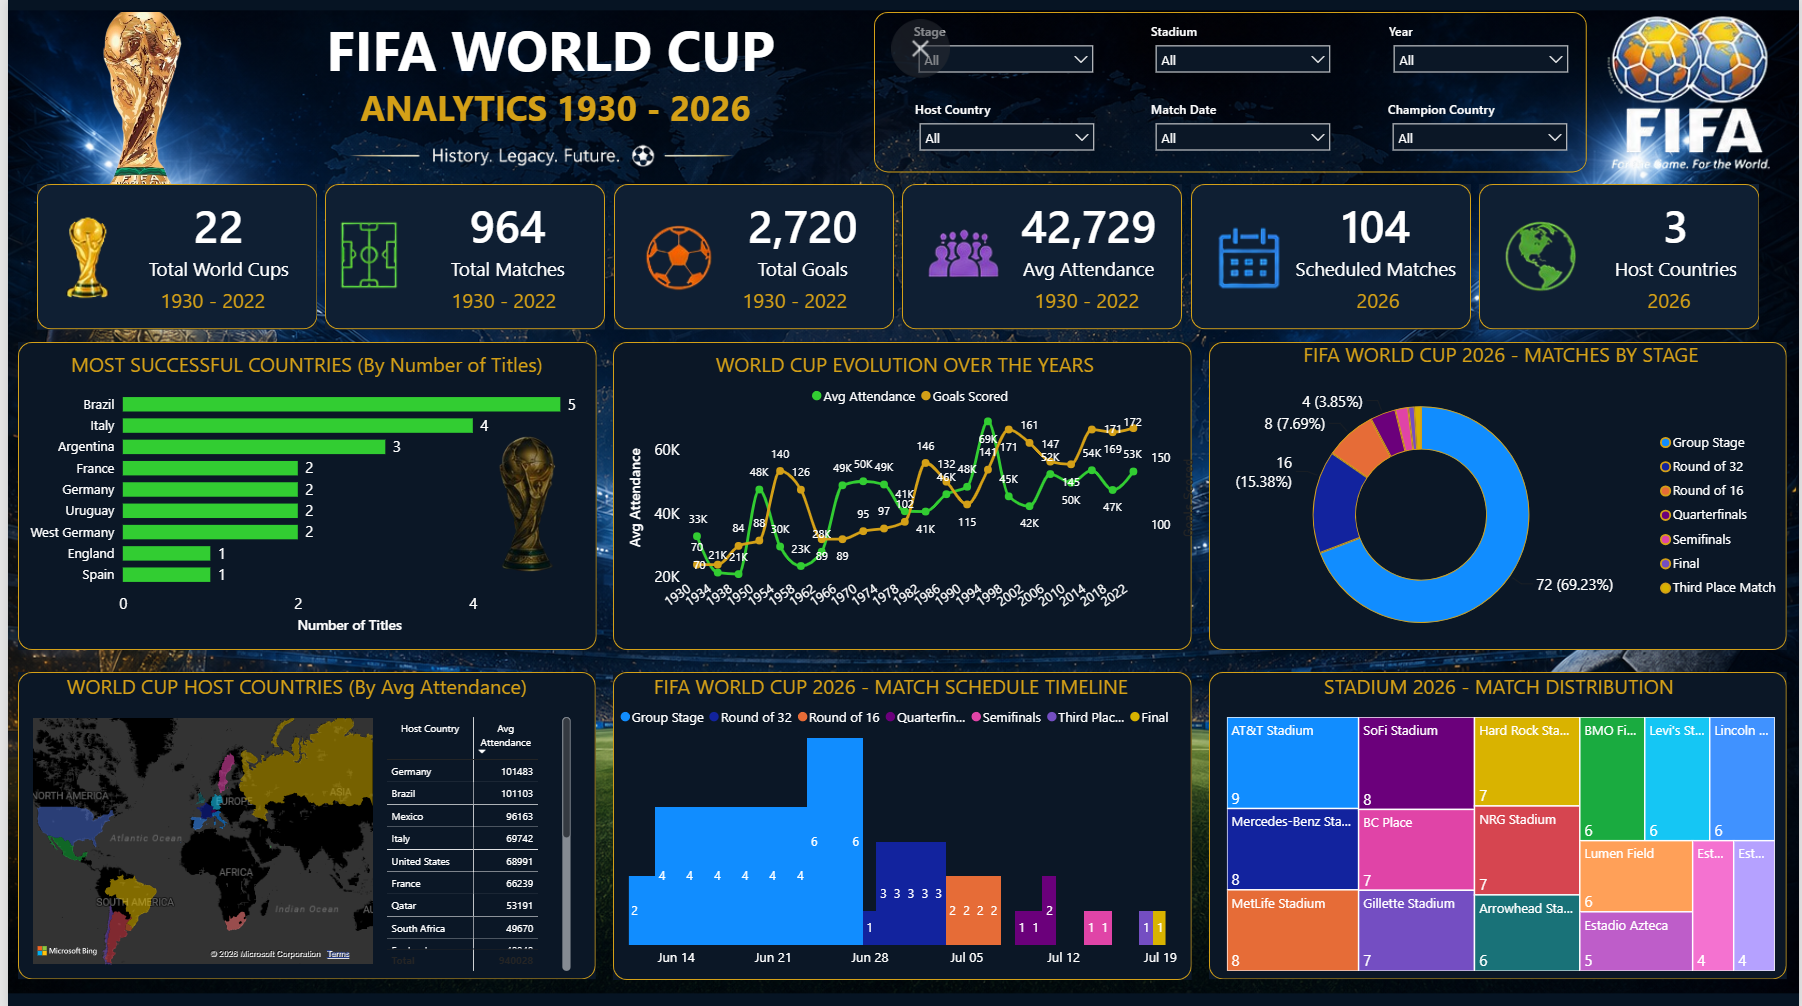
A full tournament intelligence dashboard covering 22 World Cups, 964 matches and 2,720 goals. It tracks the most successful nations, average attendance and goals evolution since 1930, and previews the 2026 edition with matches by stage, stadium distribution and the full match schedule timeline. Six slicers (stage, stadium, year, host country, match date, champion) make every visual fully interactive.
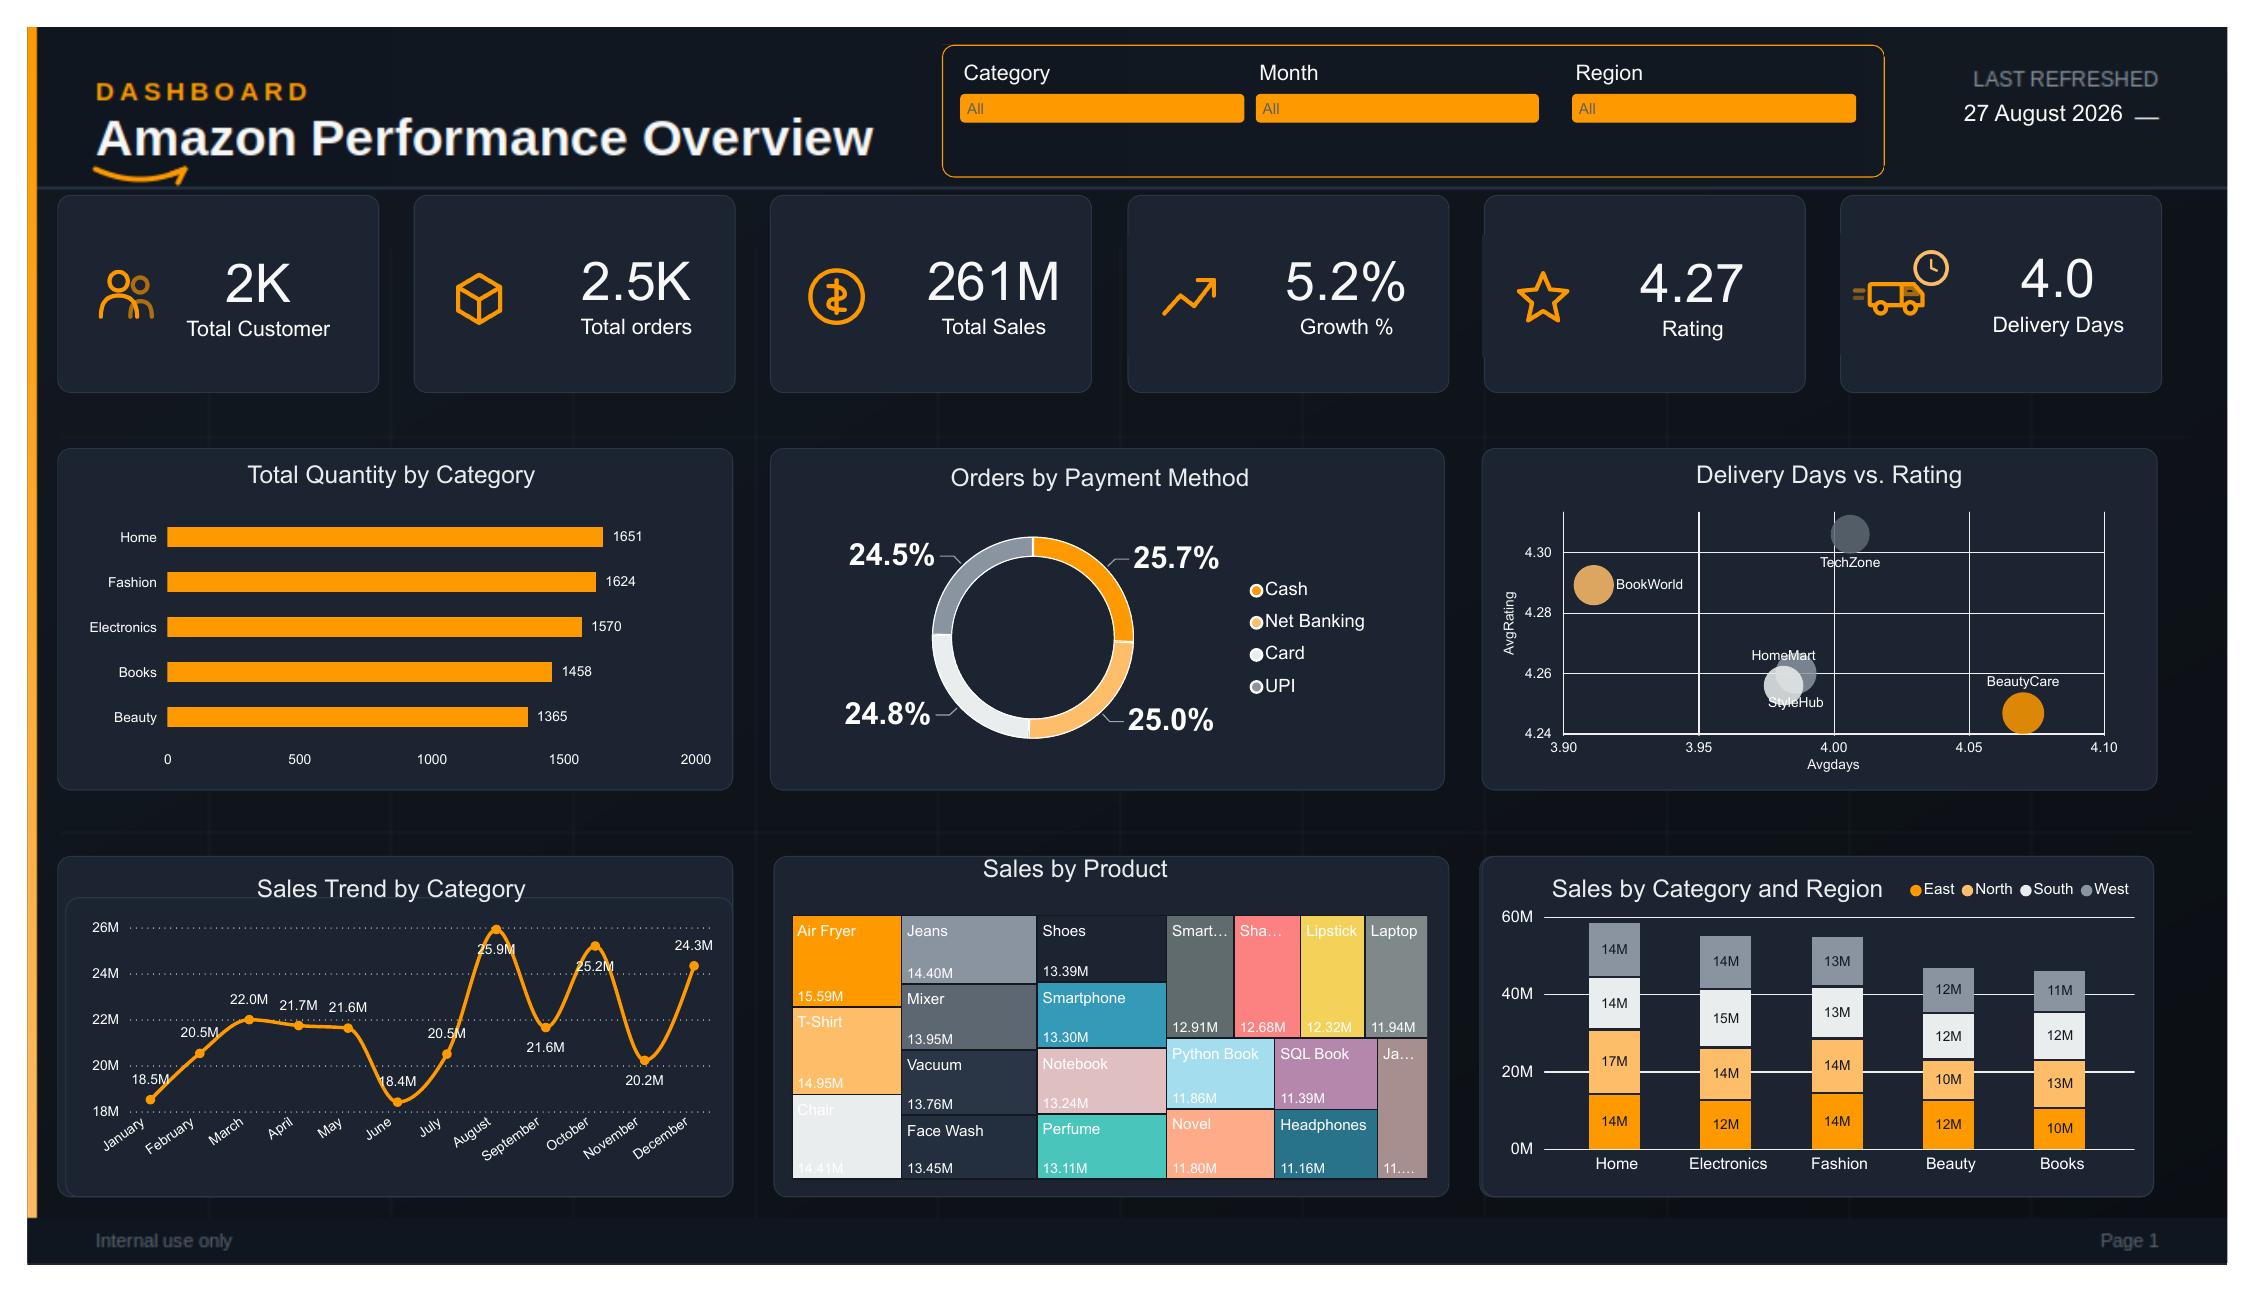
An executive retail performance dashboard tracking 2K customers, 2.5K orders and 261M in sales with 5.2% growth and a 4.27 average rating. It breaks down quantity by category, orders by payment method, delivery days vs. seller rating, monthly sales trends, top products and sales by category across four regions — with category, month and region filters for drill-down analysis.
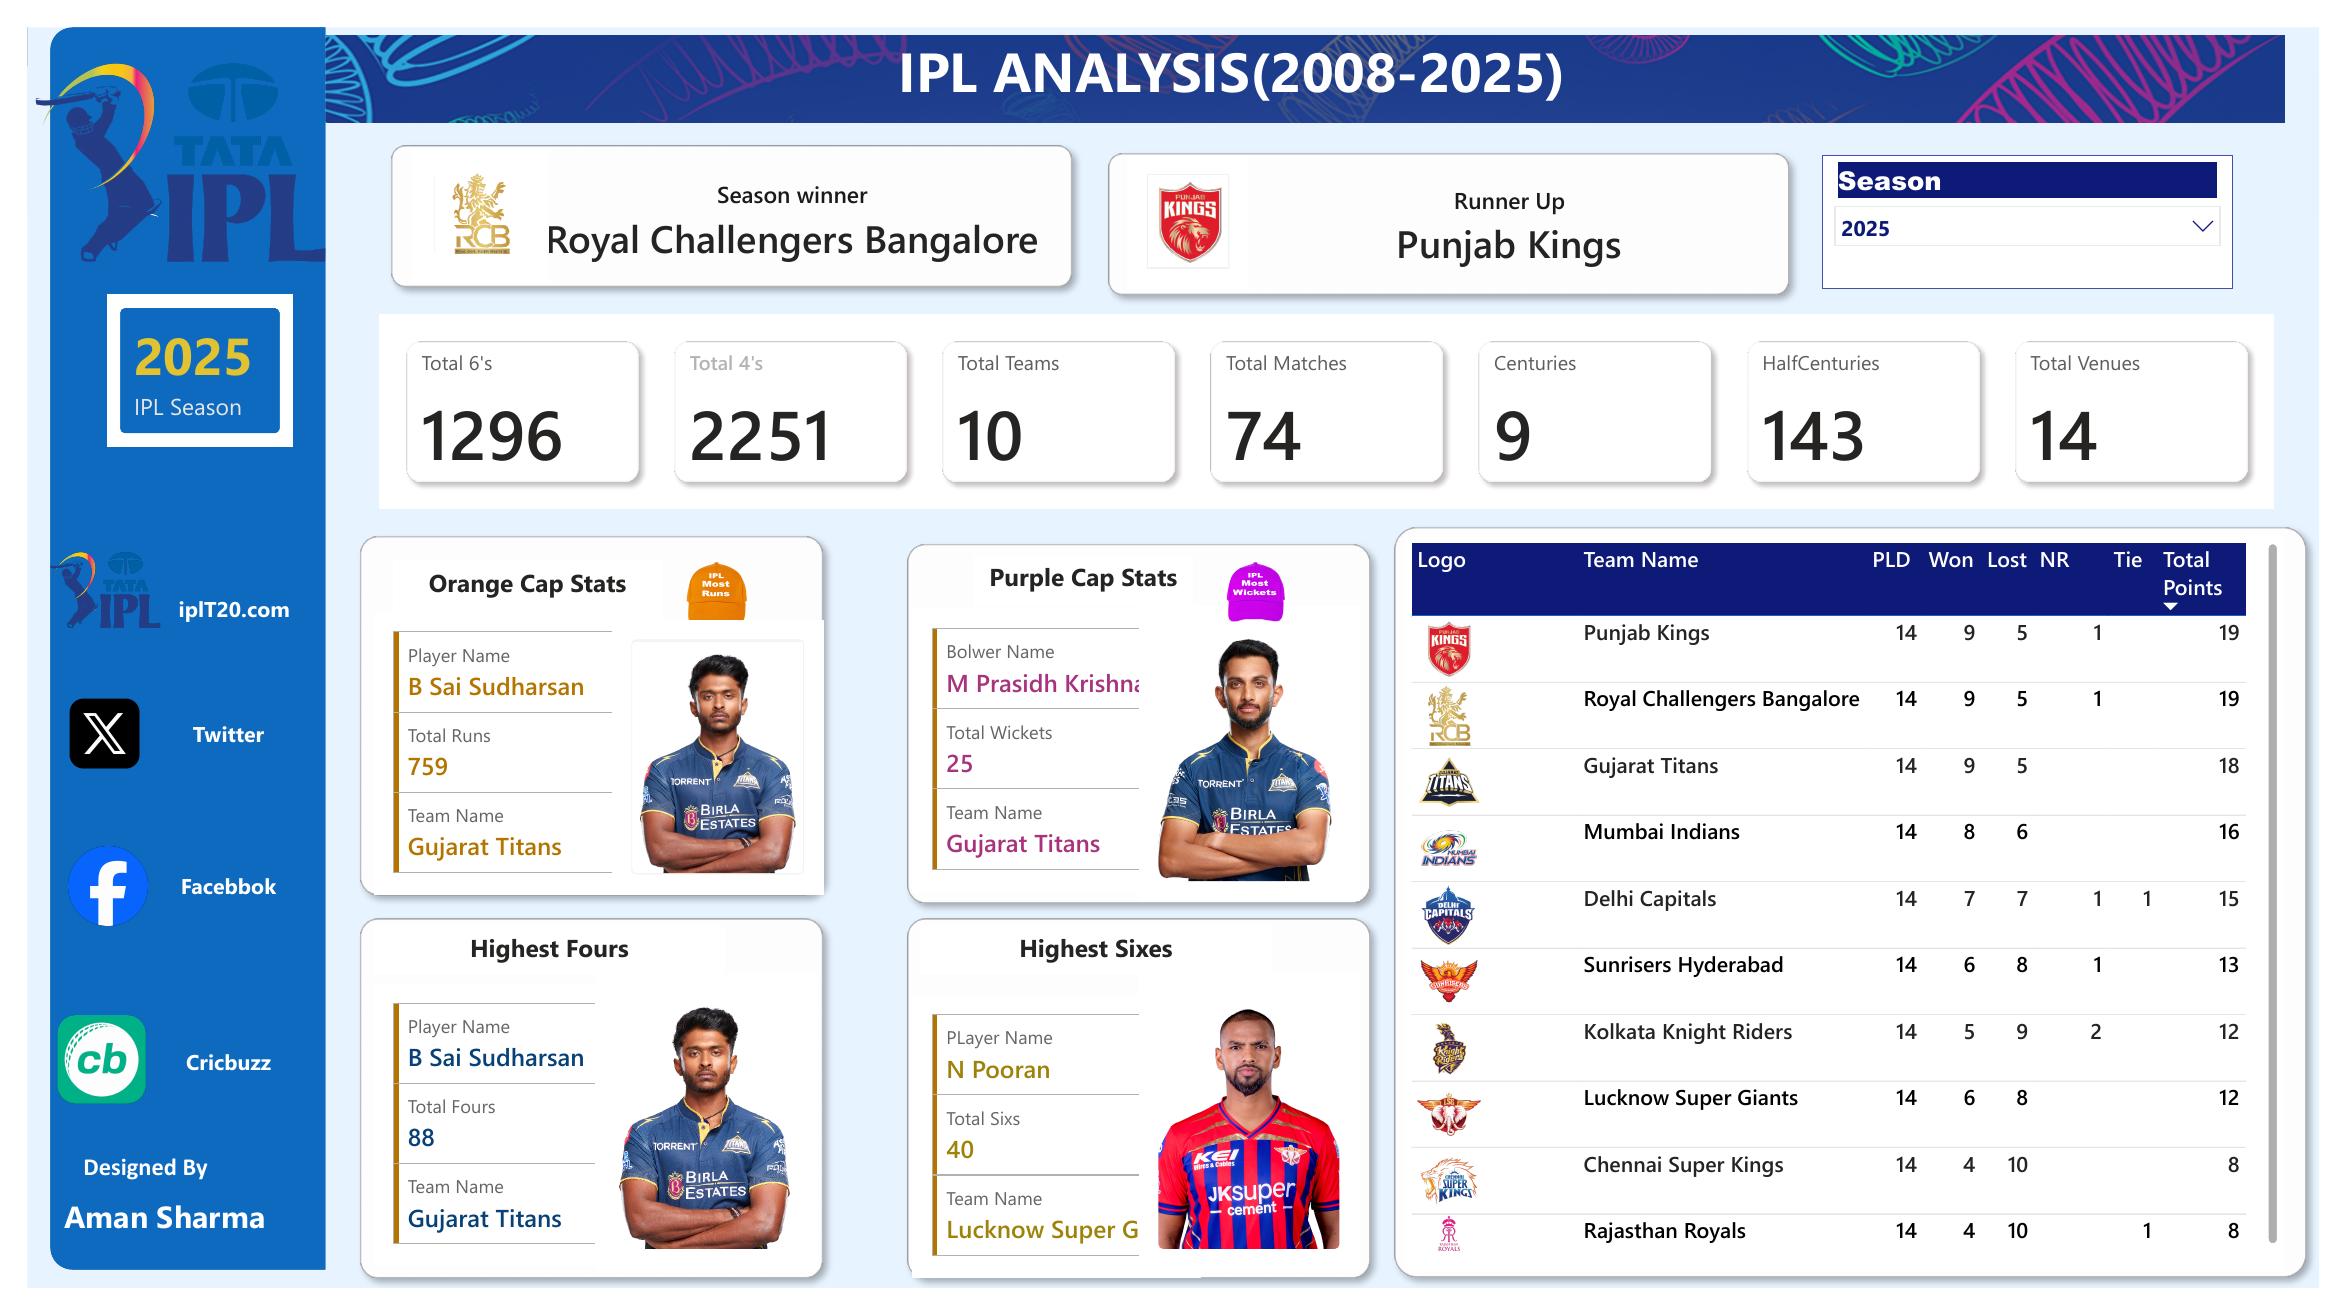
A season-deep cricket analytics dashboard covering 74 matches across 10 teams and 14 venues. It highlights the 2025 season winner and runner-up, Orange Cap and Purple Cap leaders, highest fours and sixes, and a complete points table with played, won, lost and net-result breakdowns per franchise.
Impact
15+
Interactive Power BI dashboards built
50+
SQL queries optimized
20+
Hours saved monthly via Excel macros
40%
Reduction in report generation time
Get in touch
Open to Data Analyst and BI roles — including freelance projects — all over the world.